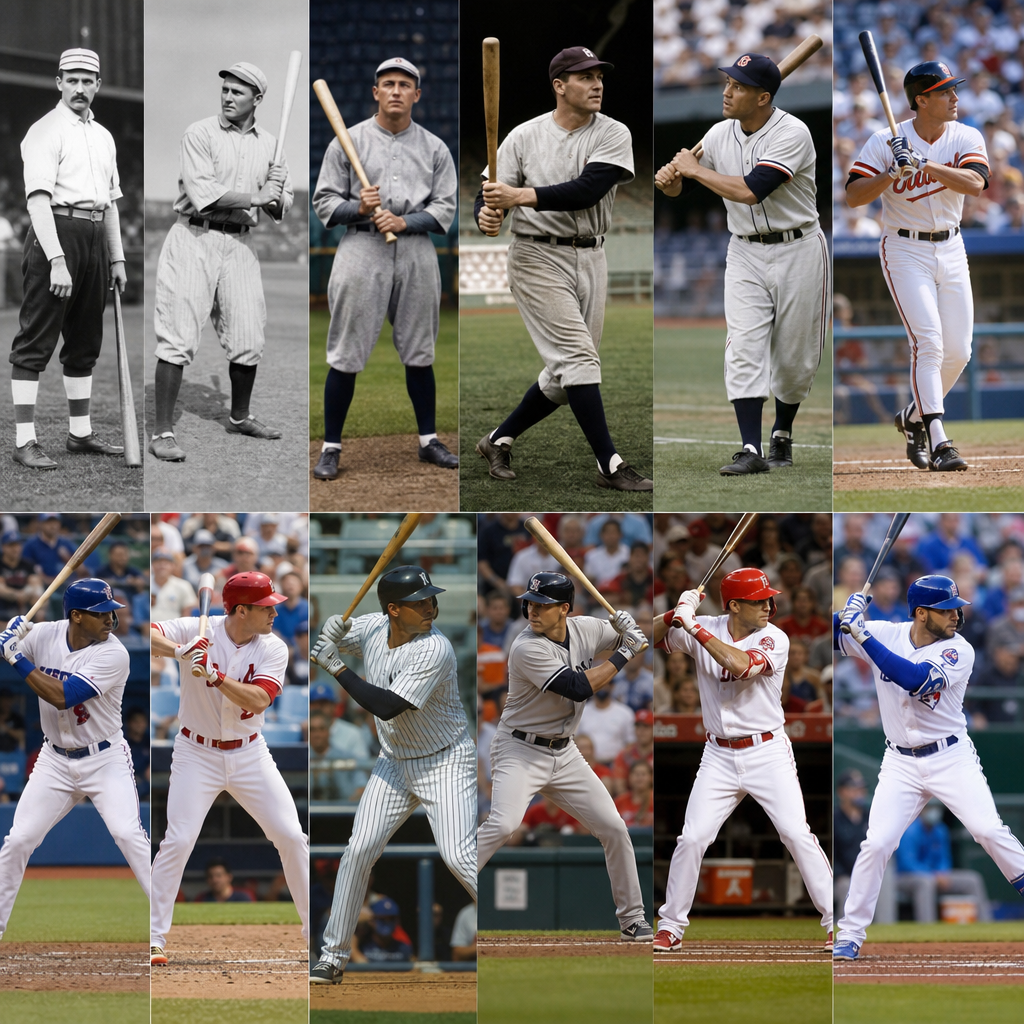
Baseball history is easiest to romanticize through legends, but the game is best understood through numbers. A decade-by-decade statistical review reveals how baseball changed in measurable ways: how often teams scored, how pitchers attacked hitters, how front offices valued defense, and how technology reshaped decision-making. In this article, “The Evolution of Baseball: A Decade-by-Decade Statistical Review,” I will use core baseball statistics and record-setting moments to trace the sport from dead-ball scarcity to today’s data-rich environment, while showing how this hub connects the broader “Statistics and Record-Breaking Moments” topic.
For clarity, a baseball statistic is any recorded measure of performance, from traditional numbers such as batting average, earned run average, wins, and home runs to modern metrics such as OPS+, ERA+, WAR, FIP, and Statcast measures like exit velocity and launch angle. Record-breaking moments are the headline events those measurements create: a 56-game hitting streak, 61 or 73 home runs, 511 strikeouts by a staff, 263 hits in a season, or 62 homers in a modern American League campaign. Looking at decades instead of isolated seasons matters because baseball environments shift. League rules change, ballparks open and close, expansion dilutes talent, integration broadens it, and equipment, travel, medicine, and analysis all alter outcomes.
I have worked with historical baseball datasets from Baseball-Reference, FanGraphs, Retrosheet, and Statcast feeds, and the same lesson appears every time: context is everything. A .300 batting average in 1930 does not mean the same thing as .300 in 1968, just as a 40-home-run season in 1927 differs from one in 2019. Decade analysis helps separate skill from environment. It also gives readers a practical framework for exploring related subtopics, including offensive trends, pitching revolutions, defensive measurement, postseason records, integration’s statistical impact, and the future of player evaluation. As a hub article, this page provides the map.
1900s to 1920s: Dead-Ball Tactics and the Live-Ball Break
The early twentieth century was defined by low scoring, ball-in-play offense, and extreme workload expectations for pitchers. In the dead-ball era, roughly 1900 through 1919, league home run totals were modest, stolen bases and sacrifice bunts carried tactical weight, and pitchers regularly completed games. The baseball itself was softer and often reused, producing fewer long drives. In 1908, often cited as a peak dead-ball season, National League teams averaged barely more than three runs per game. Batting averages could still be healthy, but slugging lagged because extra-base power was rare.
Then the 1920s changed baseball economics and aesthetics. Several factors drove the shift: cleaner baseballs entered play more often, spitball restrictions followed the 1920 season, and hitters increasingly emphasized lifting the ball. Babe Ruth became the symbol and the statistical proof. In 1918 he hit 11 home runs; in 1920 he hit 54, more than every team except one. That was not just a great season. It was evidence that the run-scoring model itself had changed. League slugging percentages rose, attendance surged, and the home run moved from novelty to central strategy.
1930s and 1940s: Offensive Expansion, War Disruption, and Integration’s Beginning
The 1930s produced some of the most offense-heavy baseball ever recorded. In 1930, the National League batted .303 collectively, a staggering figure by modern standards. High batting averages were supported by smaller parks in some cities, uneven pitching depth, and an offensive style that converted more balls in play into hits. Stars such as Jimmie Foxx, Lou Gehrig, Hank Greenberg, and Mel Ott put up power numbers that were enormous relative to their leagues. Yet even here, context matters. Raw totals rose because the environment was generous, which is why adjusted statistics like OPS+ are essential for comparison.
World War II interrupted talent supply in the 1940s as many players entered military service, affecting roster quality and statistical baselines. But the decade’s lasting significance is Jackie Robinson’s 1947 debut and the beginning of integration in Major League Baseball. This was a moral turning point and a competitive one. By expanding the player pool, teams eventually improved the overall level of play. The immediate statistical impact was gradual, but the long-term effect was profound: more elite athletes, stronger competition, and a truer major league standard. Any serious review of baseball records must treat integration as one of the most important forces behind changing numbers.
1950s and 1960s: Expansion, Dominant Arms, and the Year of the Pitcher
The 1950s balanced star power with structural change. Willie Mays, Mickey Mantle, and Henry Aaron combined athleticism, power, and durability in ways that still define all-around greatness. Television expanded the game’s reach, while relocation and eventual expansion began reshaping league geography. Statistical records remained career anchors for fan conversation: DiMaggio’s streak, Ted Williams’ on-base dominance, and Aaron’s relentless accumulation all showed that consistency mattered as much as peak performance.
By the 1960s, pitching gained a clear edge. Strike zones expanded in 1963, mound conditions favored pitchers, and offense declined sharply. The extreme point came in 1968, the “Year of the Pitcher,” when the American League hit .230 and Bob Gibson posted a 1.12 ERA. Denny McLain won 31 games, a total that now feels almost unreachable because modern pitcher usage prevents enough decisions. Major League Baseball responded by lowering the mound in 1969 and shrinking the strike zone. That rule intervention is a crucial lesson in baseball statistics: leagues actively shape statistical environments when competitive balance drifts too far.
1970s and 1980s: Free Agency, Artificial Turf, and New Analytical Language
The 1970s brought expansion, free agency after the Seitz decision, and strategic diversity. Artificial turf changed run creation in several parks, rewarding speed, line drives, and defensive range. The stolen base became a featured weapon, especially in the National League. The Oakland clubs of the early 1970s won with pitching, defense, and star-level efficiency, while the “Big Red Machine” paired patience and power with disciplined contact. Relief pitching also became more specialized. The save, formalized earlier, gained cultural weight as managers increasingly built bullpens around late-inning roles.
In the 1980s, stolen bases peaked as a tactical obsession, but a quieter revolution was taking shape in front offices and research circles. Analysts such as Bill James challenged assumptions about batting average, RBI, pitcher wins, and bunting. On-base percentage gained importance because it described run creation more directly than batting average alone. This shift did not immediately transform every clubhouse, but it laid the foundation for the modern statistical language of baseball. Understanding this decade is essential for any reader exploring record-breaking moments, because it marks the point when baseball began reevaluating what a meaningful record actually is.
1990s and 2000s: Power Explosion, Expansion Data, and the Moneyball Era
The 1990s were shaped by offense. Expansion in 1993 and 1998 altered roster distribution, smaller ballparks rewarded fly balls, and a power surge defined the decade’s signature records. In 1998, Mark McGwire and Sammy Sosa chased Roger Maris’s 61, pushing home run totals to the center of sports culture. Later, Barry Bonds set the single-season record with 73 in 2001 and transformed the statistical ceiling for plate discipline and power simultaneously. These achievements remain historically significant, but they also require discussion of performance-enhancing drugs, league oversight failures, and the difficulty of evaluating records from chemically complicated environments.
The 2000s added analytical discipline to that offensive era. “Moneyball” did not invent statistics, but it accelerated mainstream acceptance of market inefficiency, especially the underpricing of on-base percentage. Front offices increased investment in projection systems, batted-ball analysis, and player development models. WAR became a common shorthand for total value, even though different versions calculate defense and replacement level differently. Teams such as the Red Sox, Indians, and Rays showed that better process could narrow payroll gaps. The key statistical lesson from this decade is that baseball stopped treating numbers as a back-of-the-card summary and began using them as a decision engine.
2010s to Today: Statcast, Three True Outcomes, and What Comes Next
Since 2010, baseball has entered its most measurable era. Statcast, introduced league-wide in 2015 after earlier tracking systems, records exit velocity, launch angle, sprint speed, route efficiency, spin rate, and movement profiles. These data changed coaching and player evaluation at every level. Hitters optimized launch angle to convert hard contact into extra-base power. Pitchers redesigned arsenals around rising fastballs, tunneling, seam-shifted wake concepts, and breaking-ball shape. Defenders were graded with tools such as Outs Above Average, giving teams a more reliable estimate of run prevention than fielding percentage ever could.
The downside of optimization appeared in the rise of the “three true outcomes”: walks, strikeouts, and home runs. League strikeout rates climbed year after year, contact declined, and some games became less varied aesthetically. In response, MLB introduced pace and action rules, including the pitch clock, shift restrictions, and limits on disengagements. Early results showed more stolen base attempts, shorter games, and a modest recovery in balls in play. Baseball has always evolved through tension between efficiency and entertainment, and the current period is no different.
| Decade | Statistical Identity | Defining Record or Marker |
|---|---|---|
| 1900s–1910s | Low scoring, complete games, speed tactics | Dead-ball run suppression |
| 1920s | Home run revolution | Babe Ruth’s 54 in 1920 |
| 1930s | High batting averages, offense-heavy leagues | NL collective .303 average in 1930 |
| 1940s | War-disrupted rosters, integration begins | Jackie Robinson debuts in 1947 |
| 1960s | Pitching dominance | Bob Gibson’s 1.12 ERA in 1968 |
| 1970s–1980s | Speed, bullpen roles, on-base thinking emerges | Analytical reevaluation of value |
| 1990s–2000s | Power surge, advanced front offices | Home run chases and WAR adoption |
| 2010s–2020s | Tracking data, strikeout-heavy optimization | Statcast and pace-rule era |
Future statistical review will center on health, biomechanics, and player-specific development. Teams already combine motion capture, bat sensors, force plates, and high-speed video with game data to reduce injury risk and sharpen skill design. The next record-breaking moments may come from longevity as much as peak production: more players sustaining elite output into their late thirties through individualized training and recovery. At the same time, automated ball-strike technology, international talent growth, and continued schedule or postseason reforms could all reshape statistical baselines again.
Baseball’s numbers tell a richer story than nostalgia alone can provide. A decade-by-decade statistical review shows that records are never isolated facts; they are products of rules, talent pools, tactics, technology, and culture. That perspective is the core benefit of this hub within “Statistics and Record-Breaking Moments.” It helps readers compare eras fairly, understand why benchmarks move, and identify which records reflect singular greatness versus environmental advantage. If you want to go deeper, use this page as your starting point for linked explorations of offensive trends, pitching records, defensive metrics, postseason milestones, and the future of baseball analytics. The past still explains the next box score.
Frequently Asked Questions
Why is a decade-by-decade statistical review useful for understanding baseball history?
A decade-by-decade statistical review helps separate baseball myth from measurable reality. Fans often remember eras through iconic players, famous teams, and unforgettable moments, but statistics show how the sport actually functioned at different points in time. Looking at offense, pitching, fielding, baserunning, and league-wide trends by decade makes it easier to see when the game sped up, slowed down, became more power-driven, or shifted toward run prevention. For example, one decade may be defined by stolen bases and contact hitting, while another is dominated by home runs, strikeouts, and bullpen specialization. Those changes are not just stylistic impressions; they appear clearly in numbers such as runs per game, batting average, on-base percentage, slugging percentage, earned run average, strikeout rate, walk rate, and defensive efficiency.
This approach also provides needed context for evaluating players across eras. A .300 batting average, 30 home runs, or 250 strikeouts can mean very different things depending on the offensive environment of the time. In a low-scoring decade, modest raw totals may represent elite production, while in a hitter-friendly era, seemingly historic numbers may be less exceptional relative to league averages. By reviewing each decade statistically, readers can better understand why records fell, why certain strategies became popular, and how the conditions of the game influenced performance. In short, decade-based analysis turns baseball history into a clearer, more comparable story.
Which statistics best show how baseball changed from one era to another?
The most useful statistics are the ones that capture broad changes in how the game was played and valued. Runs per game is one of the clearest starting points because it reflects the overall offensive climate. From there, batting average, on-base percentage, slugging percentage, and OPS help show whether teams were relying more on contact, patience, or power. Home runs per game reveal the rise of power hitting, while strikeout and walk rates show how the battle between pitchers and hitters evolved. If strikeouts climb sharply over several decades, for example, that usually signals changes in pitching velocity, pitch design, hitting philosophy, or all three.
Pitching metrics are equally important. ERA provides a traditional benchmark, but strikeouts per nine innings, walks per nine innings, WHIP, and eventually advanced tools like FIP and ERA+ offer deeper insight into how pitchers succeeded. Defensive change can be traced through fielding percentage in earlier eras, but modern analysis often leans more on range-based and run-prevention measures because simple error totals do not tell the full story. For front office evolution, advanced metrics such as WAR, wRC+, defensive runs saved, and Statcast-based measurements illustrate how decision-makers moved beyond traditional counting stats. Together, these numbers create a fuller picture of baseball’s transformation, showing not just who performed well, but how the sport itself changed structurally and strategically over time.
How have offensive trends changed across baseball’s major eras?
Offensive trends in baseball have shifted dramatically depending on rules, ballparks, player development, equipment, strategy, and even the baseball itself. Early eras often featured lower power output, more balls in play, and a greater emphasis on speed, bunting, and situational hitting. As the live-ball era took hold, home run totals increased and sluggers became central to team construction. Later decades saw additional fluctuations, including periods of expansion-related instability, spikes in scoring, and stretches where pitching regained control. By the late 20th century and into the 21st, offensive production increasingly reflected a tension between power and contact: teams were willing to accept more strikeouts if those swings also produced more extra-base hits and home runs.
One of the biggest recent shifts has been the rise of the so-called three true outcomes approach: strikeouts, walks, and home runs. This trend reflects both hitter and pitcher behavior. Hitters began optimizing swing paths for launch angle and power, while pitchers threw harder, attacked different parts of the zone, and used sharper breaking pitches. The result was fewer balls in play and a more polarized offensive profile. At the same time, on-base percentage gained greater recognition as a foundational offensive skill, and front offices became more selective about which batting statistics they valued. A decade-by-decade review makes these changes easy to track because it shows how raw scoring levels, extra-base hit rates, and plate discipline trends rose and fell in response to the game’s evolving incentives.
How did pitching strategy and pitcher usage evolve over the decades?
Pitching has evolved from a stamina-centered model to a specialization-centered one. In earlier decades, complete games were far more common, and starting pitchers were expected to work deep into games even when facing lineups multiple times. Pitchers relied heavily on efficiency, command, and endurance because roster construction and bullpen usage were very different from what fans see today. Over time, as teams learned more about fatigue, matchup advantages, injury risk, and the penalties pitchers face when hitters see them repeatedly, the sport moved toward shorter starts and more aggressive bullpen management.
Modern pitching strategy is shaped by velocity, movement, data, and role definition. Relievers became more specialized, with setup men, closers, left-right matchup options, and multi-inning relief weapons all taking on strategic importance in different eras. Strikeout rates rose significantly as pitchers threw harder and emphasized pitch characteristics that miss bats, such as high-spin fastballs and tightly shaped breaking balls. Analytics also changed pitch selection, defensive positioning, and sequencing. Instead of simply pitching to contact, many staffs now design game plans around swing-and-miss potential and weak contact quality. A statistical review across decades reveals these changes clearly through declining complete games, increasing strikeout rates, shifting walk patterns, lower innings totals for starters, and the growing influence of bullpen ERA and leverage-based relief decisions.
What role have analytics and technology played in modern baseball evolution?
Analytics and technology have transformed baseball from both a decision-making and player-development standpoint. Front offices once leaned more heavily on scouting intuition, traditional statistics, and visible outcomes like batting average, RBIs, wins, and errors. While those measures still have a place, modern organizations now integrate advanced metrics to evaluate value more precisely. On-base percentage, slugging efficiency, park-adjusted production, pitch framing, defensive range, contact quality, and run expectancy models have all reshaped how teams judge players. This has influenced everything from drafting and free agency to lineup construction and in-game tactics.
Technology accelerated this shift by making previously invisible aspects of the game measurable. Systems such as PITCHf/x, Statcast, high-speed video, biomechanical analysis, and bat- and ball-tracking tools allow teams to evaluate spin rate, exit velocity, launch angle, route efficiency, release point consistency, and pitch movement in extraordinary detail. That data has changed how players train, how coaches teach mechanics, and how teams identify competitive advantages. Hitters can refine swing paths, pitchers can redesign arsenals, and defenders can position themselves with more precision than ever before. In a decade-by-decade statistical review, the rise of analytics appears not just in new metrics, but in visible on-field outcomes: more strikeouts, more home runs, more optimized defensive alignments, more targeted bullpen usage, and more evidence that baseball’s modern evolution is being driven by information as much as by talent.