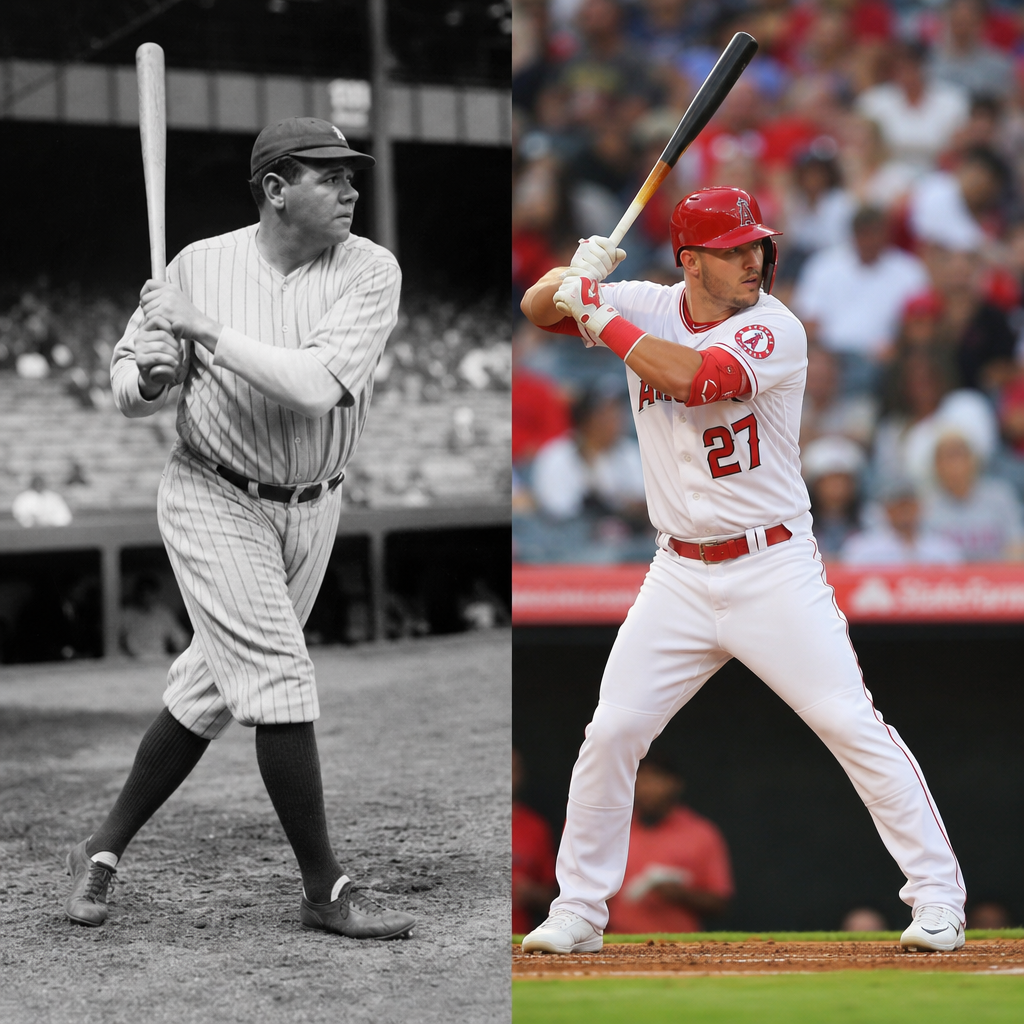
Baseball statistics have changed from simple box-score totals into a sophisticated language for understanding talent, value, and history, and that transformation is the heart of The Statistical Revolution: From Babe Ruth to Mike Trout. In the earliest decades of professional baseball, fans and executives leaned on batting average, wins, runs batted in, and home run totals because those figures were easy to record in newspapers and intuitive to discuss at the ballpark. Over time, however, the game became too complex to explain with a few familiar categories. Analysts, front offices, broadcasters, and serious fans began asking harder questions: Which numbers actually predict future performance? How much is a walk worth compared with a single? How should defense, baserunning, park effects, and league context change the way we judge a player?
Having worked through historical leaderboards, projection models, and player valuation systems for years, I have seen how this shift reshaped every baseball conversation. A hitter like Babe Ruth once looked revolutionary because his home run totals shattered the assumptions of the dead-ball era. A modern star like Mike Trout looks revolutionary for a different reason: his greatness is visible not only in traditional numbers, but also in on-base percentage, slugging, weighted runs created, Wins Above Replacement, and tracking-based fielding metrics. The statistical revolution did not replace baseball history. It gave us better tools to connect eras, test old beliefs, and explain why certain players were far ahead of their time.
This hub article reflects on the past while looking to the future. It defines the core shift from counting stats to context-rich evaluation, explains how landmark players changed statistical thinking, and shows where the next generation of baseball analysis is heading. If you want a clear framework for understanding record-breaking moments, Hall of Fame debates, and the changing meaning of greatness, this is the place to start.
From counting stats to contextual analysis
For most of baseball history, the sport ran on visible totals. Batting average measured how often a player got a hit, RBI suggested clutch production, pitcher wins implied responsibility for victory, and home runs symbolized power. Those numbers still matter because they describe real outcomes, but they have limitations. Batting average ignores walks, RBI depends heavily on teammates reaching base first, and pitcher wins often say more about run support and bullpen help than pitching quality. Once analysts began separating individual contribution from team circumstances, the conversation changed permanently.
The first major step was understanding rate statistics and context. On-base percentage showed that avoiding outs has enormous value. Slugging percentage captured extra-base power. OPS combined both into one quick snapshot, even if it weights them imperfectly. Then more advanced measures refined the picture further. OPS+ and ERA+ adjusted for park and league environment, allowing comparisons across time. WAR attempted to estimate total player value by combining offense, defense, and baserunning into wins. No metric is perfect, but these tools are better suited to answering a crucial question: how much did a player actually help his team compared with available alternatives?
This change matters because baseball eras are wildly different. Offensive levels vary. Ballparks distort numbers. Expansion, integration, training, travel, and equipment all affect performance. A .330 batting average in one decade does not mean the same thing in another. Contextual metrics are not an academic exercise; they are the only responsible way to compare players across history.
Babe Ruth and the first statistical shockwave
Babe Ruth represents the earliest true statistical rupture in modern baseball. Before Ruth, the dead-ball era emphasized bunting, contact, stolen bases, and run manufacturing. Home run totals were modest, and the strategic imagination of the sport was narrower. Ruth changed that by pairing massive power with elite overall hitting. In 1920, he hit 54 home runs for the Yankees, more than every team in the American League except the Philadelphia Phillies if you compare across both leagues that season. His 1921 slugging percentage of .846 remains one of the most astonishing marks ever produced.
Ruth’s significance is not just that he set records. He forced baseball to reconsider what offensive dominance looked like. Traditional newspapers focused on his home runs and RBI, but even basic contextual review shows a deeper kind of superiority. He drew walks at extraordinary rates, posted huge on-base percentages, and outdistanced his peers by margins that still look unreal. His career OPS+ of 206 means he was 106 percent better than league average after adjusting for park and era, one of the clearest indicators that he was not merely excellent for his time but historically overwhelming.
Ruth also reveals why era-adjusted analysis is necessary. Critics sometimes say his competition was weaker, while supporters emphasize how far ahead of the game he was. Both points belong in the discussion, but the best answer is not to ignore context. It is to use context carefully. Ruth dominated the environment he actually played in to a degree few athletes in any sport have matched.
How mid-century stars complicated the record book
After Ruth, baseball’s statistical story became richer rather than simpler. Players such as Ted Williams, Willie Mays, Mickey Mantle, Hank Aaron, and Stan Musial expanded the conversation around all-around value. Williams was perhaps the purest hitter ever, combining elite plate discipline with power. His .482 on-base percentage is the highest in major league history. Mays offered power, defense, baserunning, and durability, making him a model for modern five-tool evaluation. Aaron became the standard for sustained excellence, finishing with 755 home runs while also accumulating more than 3,700 hits.
These stars exposed the weakness of relying on one headline stat. If you focused only on batting average, you could underrate Williams’s walks. If you focused only on home runs, you might miss Mays’s defense in center field. If you focused only on peak seasons, you could miss Aaron’s extraordinary year-to-year consistency. As I have found when comparing Hall of Fame cases, the hardest part of baseball analysis is not finding numbers. It is deciding which numbers best answer the question you are asking.
The postwar period also brought integration, a development that changed both competition and statistical interpretation. Numbers compiled before full integration belong to history, but they exist in a different talent environment than those produced afterward. Serious analysis must acknowledge that reality directly. It does not erase earlier accomplishments; it refines how we compare them.
The rise of modern analytics and front-office decision making
By the late twentieth century, analysts were systematically challenging baseball orthodoxy. Run expectancy tables, linear weights, and play-by-play data made it possible to assign more precise values to events. The publication of new research and the spread of public databases changed who could participate in the debate. Baseball Prospectus, Retrosheet, FanGraphs, and Baseball-Reference gave fans and professionals access to tools that once required proprietary records or laborious manual work.
The Moneyball era accelerated adoption inside front offices. The core lesson was not that one team discovered on-base percentage in isolation. The deeper lesson was that markets can misprice skills when tradition shapes evaluation more strongly than evidence. Teams began looking for undervalued players, exploiting platoon advantages, improving defensive positioning, and using projections instead of intuition alone. Today, every club blends video, biomechanics, scouting, and quantitative models. The smartest organizations do not treat analytics and scouting as rivals. They treat them as complementary methods for reducing error.
| Era | Common Measures | Main Limitation | Modern Improvement |
|---|---|---|---|
| Dead-ball and early live-ball | Batting average, wins, RBI, home runs | Little context for walks, parks, or run environment | OBP, SLG, OPS+, ERA+ |
| Postwar expansion | Traditional leaderboards and milestone totals | Defense and baserunning undervalued | Total value models and positional adjustment |
| Moneyball period | On-base skills and cost efficiency | Public defensive data still limited | Play-by-play analysis and projection systems |
| Tracking era | Exit velocity, launch angle, spin rate | Risk of overfitting isolated measurements | Integrated player-development models |
Mike Trout and the complete modern superstar
Mike Trout is the ideal endpoint for this historical arc because his greatness is visible in every layer of analysis. Traditional stats show a star with power, speed, and production. Advanced stats show one of the best all-around players ever. Through his prime, Trout regularly combined elite on-base percentage, top-tier slugging, efficient baserunning, and strong center-field value. He won American League Rookie of the Year in 2012, then added multiple MVP awards while leading the league in WAR repeatedly.
What separates Trout in statistical history is not just accumulation, though he has done plenty of that when healthy. It is efficiency. On a per-game and per-plate-appearance basis, his offensive production compares with inner-circle legends. His career OPS+ has sat comfortably above 170 for long stretches, placing him in rare company. That matters because OPS+ allows a direct statement: Trout has not simply been excellent in a high-offense era. He has been dramatically better than his contemporaries.
Trout also embodies modern nuance. Injuries have reduced his counting totals, which affects milestone chases and public memory. That creates a useful lesson for this hub topic. Record-breaking moments capture attention, but rate dominance, peak value, and era-adjusted excellence can tell a different story from raw totals. Trout may finish with fewer famous milestones than some predecessors, yet his best seasons remain among the strongest ever measured.
Reflecting on the past, looking to the future
Baseball’s statistical future will be shaped by tracking technology, machine learning, and better health data, but the goal remains familiar: describe the game more truthfully. Statcast already measures exit velocity, launch angle, sprint speed, route efficiency, arm strength, and pitch movement. Those data points help explain why a result happened, not just what happened. A hard-hit out and a weak single no longer look identical in evaluation systems. Teams can identify sustainable skill, mechanical drift, and breakout potential earlier than ever.
The next step is integration. Isolated metrics are less valuable than connected models. The most useful future analysis will combine bat speed, swing decisions, contact quality, injury risk, defensive positioning, and aging curves into a single developmental picture. That will improve player coaching, contract decisions, and amateur scouting. It will also sharpen public debates about records, because fans will have better tools to separate skill from noise.
Still, there are limits. Defensive metrics remain volatile in small samples. Catcher framing values can shift with rule changes and measurement methods. Models are only as good as their assumptions, and baseball outcomes remain partly unpredictable by nature. The best analysts stay humble about uncertainty while remaining firm about what strong evidence shows. That balance is essential when comparing legends from Ruth’s era to Trout’s.
The statistical revolution did not make baseball colder or less human. It made the sport easier to understand in full. It helps explain why Ruth broke the game open, why Mays and Aaron were more complete than simple headlines suggested, and why Trout’s prime belongs beside the greatest ever recorded. As this subtopic hub expands into deeper articles on records, milestones, and era comparisons, keep one principle in mind: the best baseball numbers do not replace memory and debate. They sharpen them. Explore the related pieces in this series, and use them to see past, present, and future greatness with clearer eyes.
Frequently Asked Questions
How did baseball statistics evolve from Babe Ruth’s era to Mike Trout’s era?
In Babe Ruth’s time, baseball statistics were centered on the numbers that were easiest to track, print, and understand: batting average, home runs, runs batted in, pitcher wins, and earned run average. Those figures shaped how players were discussed because they appeared in box scores and newspapers every day. They gave fans a simple vocabulary for greatness, and for many decades that was enough. Ruth himself transformed the sport partly because his home run totals were so far beyond what anyone had seen before, making traditional statistics feel powerful and dramatic even without deeper context.
As the game matured, however, analysts, front offices, and fans began to ask harder questions. Was a hitter with a high batting average always more valuable than one who walked constantly and hit for power? Did a pitcher’s win total really reflect his own performance, or did it depend heavily on run support and bullpen help? These questions led to a broader statistical revolution. New measurements such as on-base percentage, slugging percentage, OPS, WAR, wRC+, FIP, and Statcast-based metrics helped explain not just what happened, but how and why it happened. By the time Mike Trout emerged, the conversation had moved well beyond basic totals. Trout’s greatness is a perfect example of the modern view because his value comes from a complete profile: power, patience, defense, baserunning, and elite consistency, all captured more accurately by advanced metrics than by traditional stats alone.
The evolution was not a rejection of baseball history but an expansion of it. Traditional statistics still matter because they provide continuity and storytelling, while advanced statistics add context and precision. The real revolution is that baseball now has a richer language for comparing players across eras, understanding hidden value, and evaluating performance with much more sophistication than was possible in Ruth’s day.
Why are traditional baseball stats like batting average and RBIs no longer considered enough?
Traditional stats are still useful, but they are no longer considered sufficient because they often miss important parts of a player’s overall contribution. Batting average, for example, measures how often a hitter gets a hit, but it ignores walks, hit-by-pitches, and the difference between a single and a home run. A player who bats .280 with elite plate discipline and extra-base power may be far more valuable than a player who bats .310 with very few walks and limited power, even though batting average alone would suggest otherwise.
RBIs present a similar issue. They can reflect hitting skill, but they are also heavily influenced by opportunity. A batter hitting behind teammates who frequently reach base will naturally pile up more RBIs than an equally skilled hitter batting in a weaker lineup. Pitcher wins have the same problem. A pitcher can throw brilliantly and still get no decision if his offense does not score, while another can pitch poorly and still earn a win because his teammates provided plenty of support. In both cases, the traditional stat records an outcome, but not necessarily the player’s true individual performance.
That is why modern analysis emphasizes context-rich metrics. On-base percentage values avoiding outs, slugging percentage captures power, OPS combines those ideas, and WAR attempts to summarize total player value across multiple dimensions. On the pitching side, metrics like FIP separate what a pitcher controls most directly from what depends on defense and luck. The reason traditional stats are no longer enough is not because they are meaningless, but because they are incomplete. Today’s baseball conversation aims to measure performance more accurately, and that requires tools that go beyond the older surface-level totals.
What role did sabermetrics play in the statistical revolution in baseball?
Sabermetrics was the engine that pushed baseball from simple recordkeeping into deeper analysis. At its core, sabermetrics is the study of baseball through objective evidence, asking which statistics actually predict value and which merely describe outcomes in a limited way. Instead of accepting long-standing assumptions, sabermetric thinkers challenged them. They questioned whether batting average truly captured offensive excellence, whether sacrifice bunts were as helpful as managers believed, and whether a pitcher’s win-loss record was a trustworthy measure of skill.
This movement gained momentum through researchers, writers, and analysts who used data to rethink how the game worked. Their work gradually influenced front offices, especially as teams looked for ways to gain an advantage in player evaluation and strategy. Sabermetrics helped organizations identify undervalued skills such as drawing walks, hitting for efficient power, controlling the strike zone, and preventing runs in ways that traditional stats did not fully recognize. Over time, the language of analysis spread from niche circles into broadcasts, mainstream media, and fan discussions.
The importance of sabermetrics is that it changed both decision-making and perception. It reshaped roster construction, lineup optimization, defensive positioning, player development, and even contract valuation. More importantly, it changed how greatness itself is defined. A player like Babe Ruth was obviously extraordinary even by old measures, but sabermetrics helps explain exactly why he was so dominant relative to his era. A player like Mike Trout, meanwhile, became a modern icon partly because advanced metrics could capture the full scope of his impact even in seasons when his RBI total or team success did not dominate headlines. In that sense, sabermetrics did not just add more numbers to baseball; it fundamentally changed how the sport understands performance.
How do advanced stats help compare players from different baseball eras?
Comparing players across eras is one of the most fascinating and difficult challenges in baseball. The sport has changed dramatically over time through expansion, integration, travel, training, ballpark dimensions, equipment, pitching depth, and overall talent distribution. Raw numbers alone can be misleading. Hitting 50 home runs in one era may not mean the same thing as hitting 50 in another, just as a .330 batting average in a high-offense environment is not automatically equivalent to the same average during a low-scoring period.
Advanced statistics help by adjusting for context. Metrics such as OPS+ and wRC+ compare a player’s production to the league average and account for ballpark effects, allowing analysts to see how dominant a player was relative to his environment. WAR goes a step further by estimating total value through offense, defense, and baserunning, while also considering positional demands. These tools do not make cross-era comparison perfect, but they create a more balanced framework than simply lining up traditional totals side by side.
This matters greatly when discussing players such as Babe Ruth and Mike Trout. Ruth’s home run totals were not just impressive in the abstract; they were astonishing relative to the offensive conditions of his era. Trout’s greatness, on the other hand, comes from his all-around excellence in a game with deeper talent pools and more specialized competition. Advanced stats help reveal both forms of dominance in a common language. They allow fans to appreciate that greatness is not only about accumulating big numbers, but also about outperforming one’s peers and contributing value in the specific context of a particular baseball age.
Why is Mike Trout often used as a symbol of modern baseball analytics?
Mike Trout is often used as a symbol of modern baseball analytics because his value is a textbook example of what advanced statistics are designed to capture. He does not rely on just one eye-catching category. Instead, he contributes in nearly every area that leads to wins: getting on base, hitting for power, running the bases intelligently, playing strong defense, and producing consistently year after year. Traditional stats showed that Trout was excellent, but advanced metrics showed just how extraordinary he was, even in seasons when his team did not make the postseason or when another player drew more attention for a single counting stat.
He also represents a shift in how fans and analysts think about superstardom. In an earlier era, a player might have been judged mainly by batting average, home runs, and RBIs. Trout often excelled in those categories too, but his case became even stronger through metrics like WAR, on-base percentage, OPS+, and other all-around indicators. Those numbers demonstrated that he was creating value in ways casual summaries sometimes overlooked. He became a favorite reference point because he validated the modern analytical view that complete players can be more impactful than headline-driven narratives suggest.
In the broader story of baseball’s statistical revolution, Trout stands at the far end of the journey that began with simple box scores. Babe Ruth became legendary through statistics the world could easily understand, while Trout became legendary in an era where the numbers are more nuanced, layered, and revealing. That makes Trout more than just a great player. He is a symbol of how baseball now measures excellence with far greater depth, precision, and appreciation for every dimension of the game.